A client calls after hours. An employee has clicked a phishing link, a business email address appears to be exposed, and nobody knows whether the password is still being used elsewhere. The MSP can reset accounts and investigate devices, but the uncomfortable question remains: what else is already exposed?
That gap between an incident and a clear view of risk is where a cyber security risk dashboard earns its place. For service providers, it is not just another technical screen. Used properly, it gives customers understandable evidence of risk, creates regular reporting conversations, and supports a monthly dark web monitoring service for businesses without requiring the MSP to build a security operation from scratch.
The need is broad. The UK government's Cyber Security Breaches Survey 2025/2026 found that 43% of UK businesses and 28% of charities experienced a cyber security breach or attack in the previous 12 months. The survey estimated that this represented about 612,000 businesses and 57,000 charities. A dashboard that helps organisations see exposed credentials and breach activity is therefore relevant to ordinary customer accounts, not only large security teams.
The Problem with Reactive Security for MSPs
The difficult call usually starts with incomplete information. A customer reports a suspicious login or a phishing message, while the MSP searches across ticketing notes, endpoint tools, email security logs and identity systems. Each tool may contain a useful clue, but the customer needs a direct answer: what has been exposed, how serious is it, and what should we do next?
Generic alerting tools rarely answer those questions in a business-friendly way. They produce events, detections and warnings, but an account manager or company director may not know which alert matters most. The MSP then spends time translating technical output into a customer update, often after the customer has already become concerned.

Visibility matters before response
The UK government's survey estimated that 19% of businesses and 14% of charities were victims of at least one cyber crime, affecting roughly 267,000 businesses and 28,000 charities. It also estimated that UK businesses experienced about 5.19 million cyber crimes over the year, figures that make continuous breach monitoring a practical operational concern rather than an optional add-on. The same source identifies phishing and compromised credentials as recurring drivers of incidents, which is precisely where clear exposure alerts help MSPs start earlier conversations.
A reactive service has a commercial weakness as well as a security weakness. Customers tend to notice the provider's value when something goes wrong, but the work is urgent, disruptive and difficult to package into a predictable service. A dashboard supports a different rhythm. The MSP can review changes, explain newly discovered exposure and recommend action before the customer has to make an emergency call.
Practical rule: If a customer can't understand the alert without an engineer beside them, the dashboard isn't doing enough of the communication work.
This doesn't mean replacing endpoint protection, identity controls or incident response. A risk dashboard sits above those services, helping the provider connect exposure to a sensible next action. That makes it useful for dark web monitoring for MSPs, particularly when the service is offered under the provider's own brand and reported as part of an existing support relationship.
What a Cyber Security Risk Dashboard Actually Is
A cyber security risk dashboard is a single interface for bringing exposure signals together, showing their significance and prompting a response. It should help a technical operator investigate, while giving a business user a concise explanation of what changed.
The simplest way to assess one is to look for three core functions.
It brings data into one view
The dashboard should aggregate relevant information, such as compromised email addresses, exposed passwords, breached domains, incident history and changes in threat activity. For a dark web monitoring service, that means continuous scanning rather than a one-off lookup performed after a customer reports trouble.
This approach is consistent with NCSC guidance on cyber security dashboards, which recommends combining the overall threat level, internal and external threat changes, operational security metrics, current risk status, control effectiveness and security initiatives. The important principle is integration. An alert without context creates work. An alert connected to a customer, domain and recommended action creates a service conversation.
It turns exposure into visual risk
A risk score, severity band or exposure category gives the reader an immediate orientation. It shouldn't pretend to be a complete measure of security, and it shouldn't conceal the underlying evidence. The useful pattern is a concise summary supported by breach details, affected accounts and a clear explanation of what the score means.
Visualisation also helps different audiences use the same information. An engineer may open the breach history, while a director may only need to see that a business domain has new credential exposure requiring password resets and stronger authentication controls.

It produces actionable alerts
A useful alert answers four questions:
- What changed? For example, an email address or domain has appeared in a breach.
- Who is affected? Identify the customer, account or business domain.
- Why does it matter? Explain the likely exposure in plain English.
- What should happen next? Recommend password resets, MFA enforcement, account review or other suitable controls.
The technical build matters too. Providers planning integrations can use this dashboard guide for API integration to think through data sources, presentation and workflow. The aim isn't to create a crowded security operations centre screen. It's to create a dependable, branded view that lets a service provider demonstrate ongoing value.
Key Metrics and Visualisations to Include
A dashboard becomes useful when every prominent metric supports a decision. More tiles don't create more clarity. MSPs should prioritise information that a customer can understand and that an account team can turn into a recommendation.
Risk scores
A risk score provides a quick summary of current exposure. It works best when the dashboard also shows the reasons behind it, such as the number of compromised email addresses, exposed passwords or breached domains. The score should guide attention, not replace investigation.
For customer reporting, the commercial benefit is straightforward. An MSP can show whether risk is stable, improving or worsening, then tie the movement to actions already taken. That makes a monthly review more meaningful than a list of tickets closed.
Breach timelines
A breach timeline shows when exposure was identified and how it has changed. It helps customers distinguish an old record from a newly detected event, while giving the MSP a basis for discussing response speed and outstanding remediation.
The ICO's personal data security incident trends dataset is updated by quarter and can provide useful UK-specific context for tracking reported breach patterns. A provider shouldn't imply that a customer's dark web exposure is directly represented in that dataset, but the broader trend view can help frame why incident monitoring deserves regular attention.
Domain monitoring
Domain monitoring tracks whether company email domains appear in breached data. It's particularly useful for customers that have many users, multiple brands or a mixture of internal and outsourced services. A domain-level view helps the MSP identify exposure that an individual email check could miss.
The dashboard should make the result understandable. “Your domain has exposure linked to compromised credentials” is more useful to a director than a raw feed of records without explanation.
Compromised credentials
Credential exposure is usually the most actionable metric in a dark web monitoring service. The dashboard should show affected email addresses, exposed password indicators where safely available, discovery dates and response guidance. It should never encourage users to display sensitive information unnecessarily.
The issue is visible across UK sectors. Jisc reported that more than 144,000 username-and-password combinations tied to UK education and research users were found compromised in the 12 months to June 2026, with more than 25,000 credentials discovered on the dark web in May 2026 alone, as reported by Times Higher Education. For an MSP, that supports a practical conversation about unique passwords, password resets and MFA.
Trending threats
Trend views reveal whether exposure is recurring, concentrated around a domain or increasing after a particular campaign. They can show breach categories, credential discoveries and alert severity over time. A trend is more useful than an isolated count because it gives the customer a reason to review controls rather than only acknowledge an event.
| Metric | Purpose | Client benefit |
|---|---|---|
| Risk score | Summarises current exposure | A clear starting point for discussion |
| Breach timeline | Shows discovery and change over time | Better understanding of urgency |
| Domain monitoring | Identifies exposure linked to company domains | Wider visibility across user accounts |
| Compromised credentials | Highlights accounts requiring action | Direct guidance on resets and MFA |
| Trending threats | Shows recurring or emerging patterns | Evidence for control improvements |
For customers that need broader governance evidence, a practical compliance checklist for SaaS teams can help connect dashboard evidence with wider control documentation. The dashboard shouldn't claim compliance by itself. It should make relevant risk information easier to review and record.
How MSPs and Resellers Should Interpret Dashboard Data
Data doesn't create value until someone interprets it. The provider's role is to convert an alert into a decision, then record the decision so the next review shows whether the customer acted.
Consider two dashboard outcomes. A high risk score caused by compromised credentials should lead to an account review, password resets and MFA enforcement. Domain exposure may prompt an assessment of email security, identity controls and user awareness. The same alert can require different advice depending on the customer's systems and risk tolerance.

Raw alerts versus service recommendations
A generic cybersecurity dashboard often favours technical completeness. That can suit a security team with time to investigate multiple feeds, but it creates friction for an MSP trying to package a service for ordinary businesses.
A purpose-built, white-label view should favour three things:
- Prioritisation: Put the most urgent exposure first.
- Explanation: Describe the risk without assuming security expertise.
- Ownership: Let the MSP deliver the message under its own company identity.
GoSafe Dark Web monitoring is one example of a Dark Web Monitoring tool built around continuous scanning, compromised email detection, exposed password alerts, breached domain monitoring and simple risk reporting. The point for a reseller isn't to present another complex security suite. It's to provide an understandable service that sits alongside IT support, hosting, connectivity or cloud management.
For a deeper explanation of dark web exposure risk scoring, partners can use risk scoring as a discussion aid rather than a promise of certainty. A score should open the conversation, while the breach breakdown and recommended response determine the work.
Turn reviews into recurring value
A monthly report should show what changed, which recommendations remain open and what the provider will do next. That creates continuity without forcing the MSP to treat every alert as a separate project.
The commercial difference is significant. A one-off scan can identify a problem, but recurring monitoring gives the customer a reason to keep the service. The MSP remains involved as an adviser, not only as the supplier called after a breach.
White-Label Implementation and Commercial Benefits
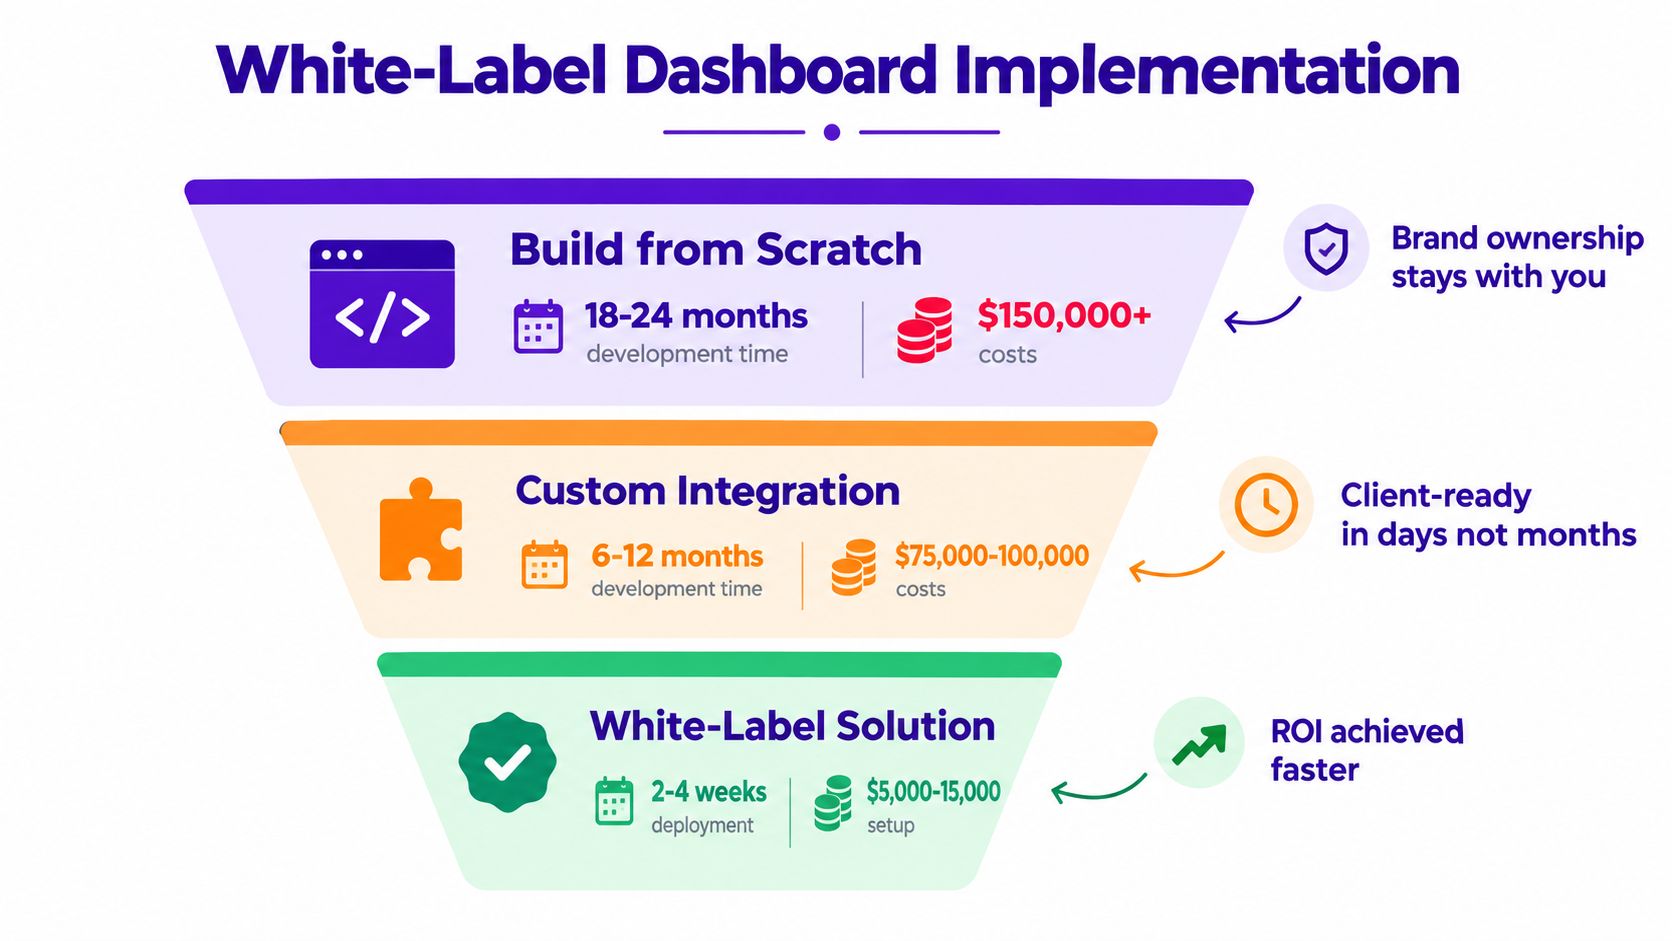
Building a dashboard internally usually means more than commissioning a screen. The provider must source data, manage alert logic, protect sensitive information, maintain integrations, create reporting workflows and support the product. That can distract an MSP from its core service and make a new offering difficult to launch.
A fully white-label model changes the operating equation. The partner can brand the platform as its own service, sell it under its company name and include it in its existing product portfolio. Customers deal with the partner, while the underlying Dark Web Monitoring tool supplies continuous scanning and clear alerts.
Why white-label suits service providers
No complex setup matters because an MSP's engineers already have a full workload. The partner doesn't need to build security tools internally or create a specialist monitoring team. GoSafe is designed to run in the background, identify compromised email addresses, exposed passwords and breached domains, then present the findings through a straightforward dashboard.
The service also fits familiar commercial models. A provider can add a monthly subscription to an existing IT support agreement, offer it during a hosting renewal or include it in a telecom and VoIP account review. That makes recurring revenue security services easier to explain than a large, separate security project.
The GoSafe Dark Web monitoring platform supports this white-label approach by giving partners a branded service they can offer without needing specialist security knowledge. The partner controls the customer relationship, pricing and positioning, while the platform provides the monitoring and reporting capability.
Sell the outcome, not the interface
Customers rarely buy a dashboard because they want another login. They buy earlier warning, visibility and peace of mind. The sales conversation should therefore start with questions about how the customer discovers compromised accounts, who reviews alerts and what happens after a credential appears in breached data.
A practical offer might include continuous monitoring, clear email alerts, a monthly review and response guidance. The MSP can then attach related work, such as identity hardening, MFA rollout, phishing training or account remediation, where those services fit the customer's needs.
That creates a credible upsell for IT support companies, telecom providers, hosting businesses, web agencies, SaaS resellers and technology resellers. It also differentiates the provider through a service customers can see and understand, without adding a heavy operational burden.
Best Practices for Deployment and Client Reporting
Deployment should begin with the customer journey, not the dashboard settings. Decide who receives alerts, who validates them, how the MSP records actions and how the customer sees progress. A technically correct platform can still fail if alerts go to an unattended inbox or reports arrive without an explanation.
Start with a controlled rollout
Use a small group of existing customers to test the offer. Choose businesses with different levels of technical maturity, then refine the onboarding message, alert wording and reporting template based on the questions they ask.
The initial process should cover:
- Brand the experience: Apply the partner's name, colours and service language so the product feels like part of the existing portfolio.
- Set responsibilities: Define who reviews alerts, contacts the customer and closes remediation tasks.
- Establish thresholds: Agree what counts as urgent, important or suitable for the next scheduled review.
- Create a response path: Link exposed credentials to practical actions, including password resets, MFA checks and account investigation.
- Schedule reviews: Use a consistent monthly rhythm so customers see changes rather than isolated events.
Make reports readable
A customer report should lead with the current position, then show changes since the previous review. Include the affected domain or accounts, discovery context, severity and recommended next step. Avoid copying every technical field into the customer version.
A short management summary might state that new credential exposure was detected, which users require attention and whether the previous recommendations were completed. The technical appendix can hold deeper evidence for the customer's IT contact.
A white label risk monitoring platform works best when the provider connects monitoring to an ongoing service process. The dashboard supplies visibility, but the MSP supplies judgement, communication and follow-through.
Review the service commercially
Track which customers have adopted the service, which alerts lead to remediation and which adjacent services customers request afterwards. Don't force an upsell after every alert. Use the evidence to identify a genuine control gap, then offer a suitable improvement.
The strongest deployment model is quiet between reviews, responsive when exposure appears and consistent in its reporting. That combination makes dark web monitoring feel like a managed service rather than a frightening one-off scan.
GoSafe Dark Web monitoring gives service providers continuous scanning for compromised email addresses, exposed passwords and breached domains, with clear alerts and a simple dashboard that customers can understand. Visit GoSafe Dark Web monitoring to see how you can add white-label dark web monitoring to your portfolio and build a practical recurring service around your existing customer relationships.