
The latest UK government survey estimated that 43% of UK businesses experienced a cyber security breach or attack in the previous 12 months, affecting roughly 612,000 businesses. Phishing remained the most common threat, affecting 38% of businesses, while 20% of businesses had been victims of at least one cyber crime. These figures create a useful national baseline, but they don't tell an accountancy practice, telecom customer, or manufacturing firm what its own exposure means in pounds.
That translation is the practical purpose of cyber risk quantification. For MSPs, IT support companies, telecom providers, SaaS resellers, and cyber consultants, it provides a way to turn technical observations into a commercial conversation about loss, controls, insurance, and recurring services. Dark web monitoring is particularly useful because exposed credentials provide an external signal that can be tied to a named customer, domain, and threat scenario.
What Cyber Risk Quantification Actually Means
Cyber risk quantification is a repeatable method for estimating potential financial loss from defined cyber scenarios. It replaces an isolated “high risk” label with a reasoned estimate based on how likely a loss is, what assets or processes are exposed, and how much the organisation could lose if the scenario occurs.
That distinction matters in a customer meeting. A managing director may not care about a vulnerability score in isolation, but they will care about fraudulent payments, interrupted operations, lost client information, recovery costs, and the effect an incident could have on customer confidence. The service provider's job is to connect the technical finding to one of those business outcomes without pretending the model offers certainty.
From coloured boxes to defensible figures
A qualitative heat map still has a place. It's quick to produce, easy to read, and useful when a customer has limited information. The problem appears when different assessors interpret “medium” differently, or when a buyer asks why one “high” risk deserves more investment than another.
Quantitative modelling addresses that weakness by documenting assumptions and showing the calculation. A typical model considers:
- Threat likelihood: How often the relevant event might occur.
- Exposure: Whether the customer has leaked credentials, vulnerable access routes, valuable data, or critical dependencies.
- Loss magnitude: The direct and indirect costs that could follow.
- Control effect: How a measure such as MFA, credential resets, monitoring, or staff training changes likelihood or impact.
The output might be an expected annual loss, a loss range, or a scenario comparison. It should always include the assumptions behind it. A figure without an explanation is no more useful than a coloured box.
Practical rule: Give the customer a number they can challenge, then show the evidence and assumptions that produced it.
Why the method matters commercially
CRQ isn't a product category by itself. It's a discipline that combines internal asset information, external threat signals, control evidence, and relevant loss data. The result becomes a common language between a service provider's technical team and the customer's finance director or board.
UK public data now supports more grounded conversations. Government research estimates the average cost of a significant cyber attack at almost £195,000 per UK business, with an annual economy-wide cost of £14.7 billion, equivalent to 0.5% of UK GDP. Those figures are national anchors rather than customer-specific forecasts, so an MSP should use them for context and calibration, not as a promise that every customer faces the same loss. The UK government's economic impact research provides that broader reference point.
For a reseller, the opportunity is practical. A quantified risk review can support a managed monitoring subscription, an identity protection service, security awareness work, incident response preparation, or an insurance discussion. The number gives the service a business purpose, while the evidence gives the renewal conversation substance.
Comparing the Main CRQ Approaches and Frameworks
Service providers usually encounter three broad approaches. They aren't mutually exclusive, but they demand different levels of data, analyst time, and customer participation.
Three ways to express cyber risk
A qualitative heat map places scenarios on likelihood and impact axes, often using red, amber, and green categories. It works well for an initial customer conversation or a rapid portfolio review because the output is familiar and inexpensive to produce. It doesn't work as well when a customer wants to compare cyber risk with cash-flow exposure, insurance retention, or the cost of a proposed control.
A quantitative monetary model expresses exposure in pounds. Annual Loss Expectancy, Single Loss Expectancy, and VaR-style outputs can support budgeting, board reporting, and insurance conversations. The trade-off is obvious: the model needs better inputs, documented assumptions, and someone who can explain uncertainty without creating false precision.
FAIR, Factor Analysis of Information Risk, provides a structured way to model risk as loss event frequency and probable loss magnitude. It offers a disciplined vocabulary for separating how often an event may happen from how severe the resulting loss could be. Its logic is valuable for service providers, but a full FAIR engagement can be too time-consuming for a small customer unless the scope is tightly controlled.
| Approach | Output Format | Data Requirements | Best Fit |
|---|---|---|---|
| Qualitative heat map | Red, amber, green ratings or ordinal scores | Basic interviews, asset knowledge, control observations | Fast reviews and early-stage customer conversations |
| Monetary model | Pound values, ranges, ALE, scenario loss estimates | Threat, asset, impact, control, and loss assumptions | Board, budget, renewal, and insurance discussions |
| FAIR-aligned model | Loss event frequency and probable loss magnitude | Structured scenarios, ranges, evidence, and calibration | Repeatable portfolio modelling with stronger governance |
Where each approach earns its place
A heat map is efficient, but it can make a service appear advisory rather than measurable. A monetary model is easier to sell when the customer is already discussing insurance, investment, or material business interruption, but it can become fragile if the inputs are guessed. FAIR provides the strongest underlying logic, yet a service provider needs a lighter operating version for routine SMB work.
The practical answer is often FAIR-lite. Define a small set of loss scenarios, estimate frequency and magnitude as ranges, document the source of each assumption, and update the inputs when new evidence appears. That retains the useful structure of FAIR without forcing every customer through an enterprise risk exercise.
Dark web exposure is particularly helpful on the frequency side. A leaked corporate credential doesn't prove that a loss will occur, but it changes the scenario from a general possibility to a threat condition connected to a real organisation. That makes a simplified monetary model more defensible than a generic likelihood score.
A reseller shouldn't sell the framework first. Sell the decision it supports. The customer wants to know which exposure deserves attention, what action will reduce it, and how the service provider will demonstrate change at the next review.
Key Metrics and a Practical Calculation Example
The core calculation is simple enough to explain in a customer meeting:
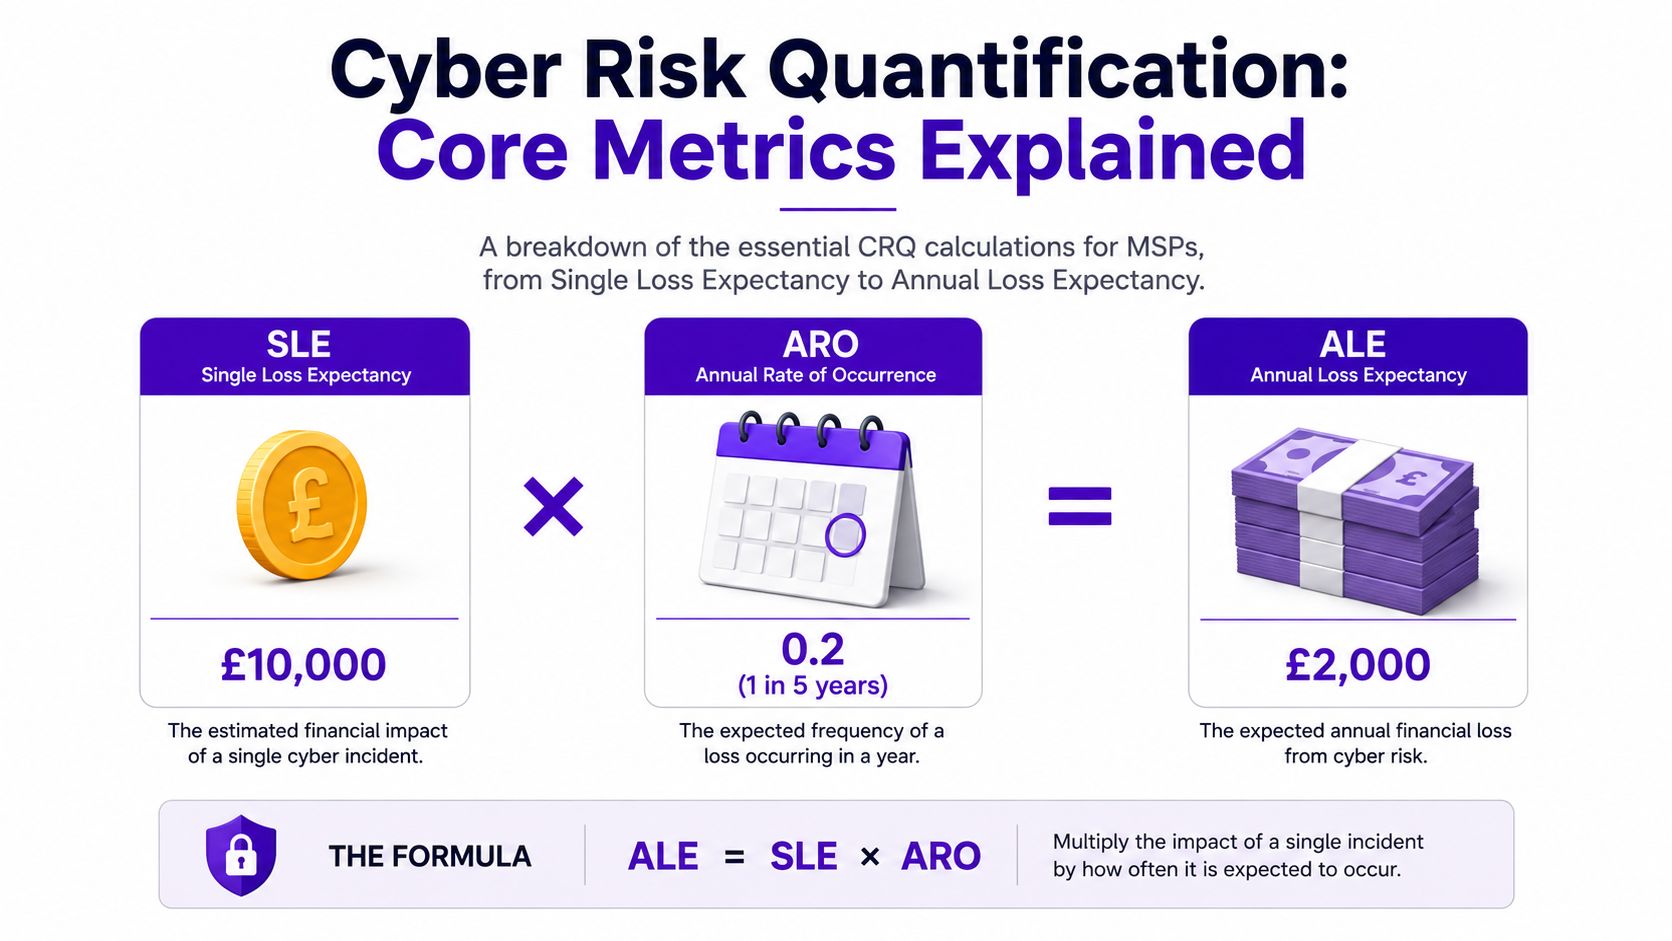
Annual Loss Expectancy, or ALE, equals Single Loss Expectancy, or SLE, multiplied by Annual Rate of Occurrence, or ARO.
SLE estimates the financial impact of one defined loss event. ARO estimates how often that event may occur in a year. ALE combines them into an annualised figure. The model becomes useful when the inputs are tied to a scenario rather than a vague category such as “email security”.
Other measures strengthen the picture:
- Probable maximum loss: A severe but plausible outcome used for resilience and insurance discussions.
- Loss event frequency range: A lower and upper estimate that reflects uncertainty.
- Threat-event-to-loss-event conversion: The proportion of threat activity expected to become a business loss, rather than merely an attempted event.
The GoSafe white-label risk monitoring approach can help a reseller connect a live risk score with a broader customer discussion. For readers who need a separate explanation of how scores can be understood in a WordPress context, interpret risk scores for WordPress offers useful background.
A worked UK SMB scenario
Consider a 45-seat accountancy practice that holds client personal information and relies heavily on email. Define one scenario: an attacker uses a compromised mailbox to alter supplier payment details, causing a fraudulent invoice payment and creating recovery, investigation, and reputational costs.
For this scenario:
- SLE: £32,000.
- ARO: 0.4.
- ALE: £32,000 × 0.4 = £12,800 per year.
The ARO in this example is an analytical assumption based on sector incident experience and increased exposure from an active dark web credential disclosure. It isn't a universal rate for accountancy firms. The MSP should record why the assumption was selected, which evidence supports it, and what would cause the value to move.
If exposed credentials are remediated quickly, the estimated frequency may fall. If a new dump shows active mailbox passwords, the frequency assumption may rise because the attacker's access effort is lower. The point isn't to claim that a breach is inevitable. The point is to show that new evidence changes the model in a traceable way.
Use ranges wherever the evidence is uncertain. A customer will trust £8,000 to £18,000 of expected annual exposure with documented assumptions more than a precise figure that appears to have been produced by a black box. The same record can support a risk register, a control recommendation, and a conversation with an insurance underwriter.
How Dark Web Monitoring Feeds Into CRQ
Dark web monitoring supplies continuous external telemetry for the model. Instead of relying only on an annual questionnaire or a customer's memory of past incidents, the service provider can observe whether corporate email addresses, passwords, domains, or other exposed data appear in breach material.
The alert doesn't equal a confirmed compromise. It does provide evidence that an attacker may have access to credentials or information linked to the customer. That evidence can change the likelihood input for a defined scenario, shorten the assumed exposure window, and trigger a control review.
Turning an alert into a model update
A practical workflow looks like this:
- Identify the customer connection. Confirm the affected email address or domain belongs to the organisation and record the discovery date.
- Classify the scenario. Link the exposure to credential stuffing, phishing, business email compromise, remote access, or another relevant loss event.
- Review controls. Check whether the account has been reset, MFA is enforced, sessions have been revoked, and related accounts have been examined.
- Update the estimate. Adjust the frequency range or exposure period, document the reason, and record the remediation action.
- Report the movement. Show the customer what changed, why it changed, and which service will reduce the exposure.
An accountancy practice with several leaked mailbox passwords should receive a higher phishing-driven loss estimate than the same practice with no known exposure, all else being equal. The MSP shouldn't multiply the number of alerts mechanically. It should assess whether the credentials are active, whether they protect valuable processes, and whether controls reduce the chance of successful use.

Why clean alerts matter to resellers
Customers don't want an intimidating threat-intelligence console. They want to know what was exposed, who needs to act, and what happens next. A clear alert with a timestamp, affected domain, exposure type, and recommended response gives the account manager something useful to discuss during a review.
GoSafe is one example of a white-label Dark Web monitoring tool that continuously scans for compromised email addresses, exposed passwords, and breached domains, then presents clear alerts through a brandable service experience. It can be deployed by a partner without building its own security tool or maintaining an in-house threat intelligence function.
The commercial value comes from the operating model, not from the alert alone. A reseller can package monitoring, alert triage, credential remediation, and quarterly risk reporting as a monthly subscription. The partner retains the customer relationship and uses evidence from the service to identify additional work.
For a broader comparison of providers and approaches, service providers can compare dark web intelligence services before choosing the signal source that fits their portfolio.
A Practical Implementation Roadmap for Service Providers
A reseller doesn't need to build a complete enterprise quantification practice before testing customer demand. A controlled rollout can start with representative accounts, a limited scenario set, and a reporting format that account managers can use confidently.
Phase one and phase two
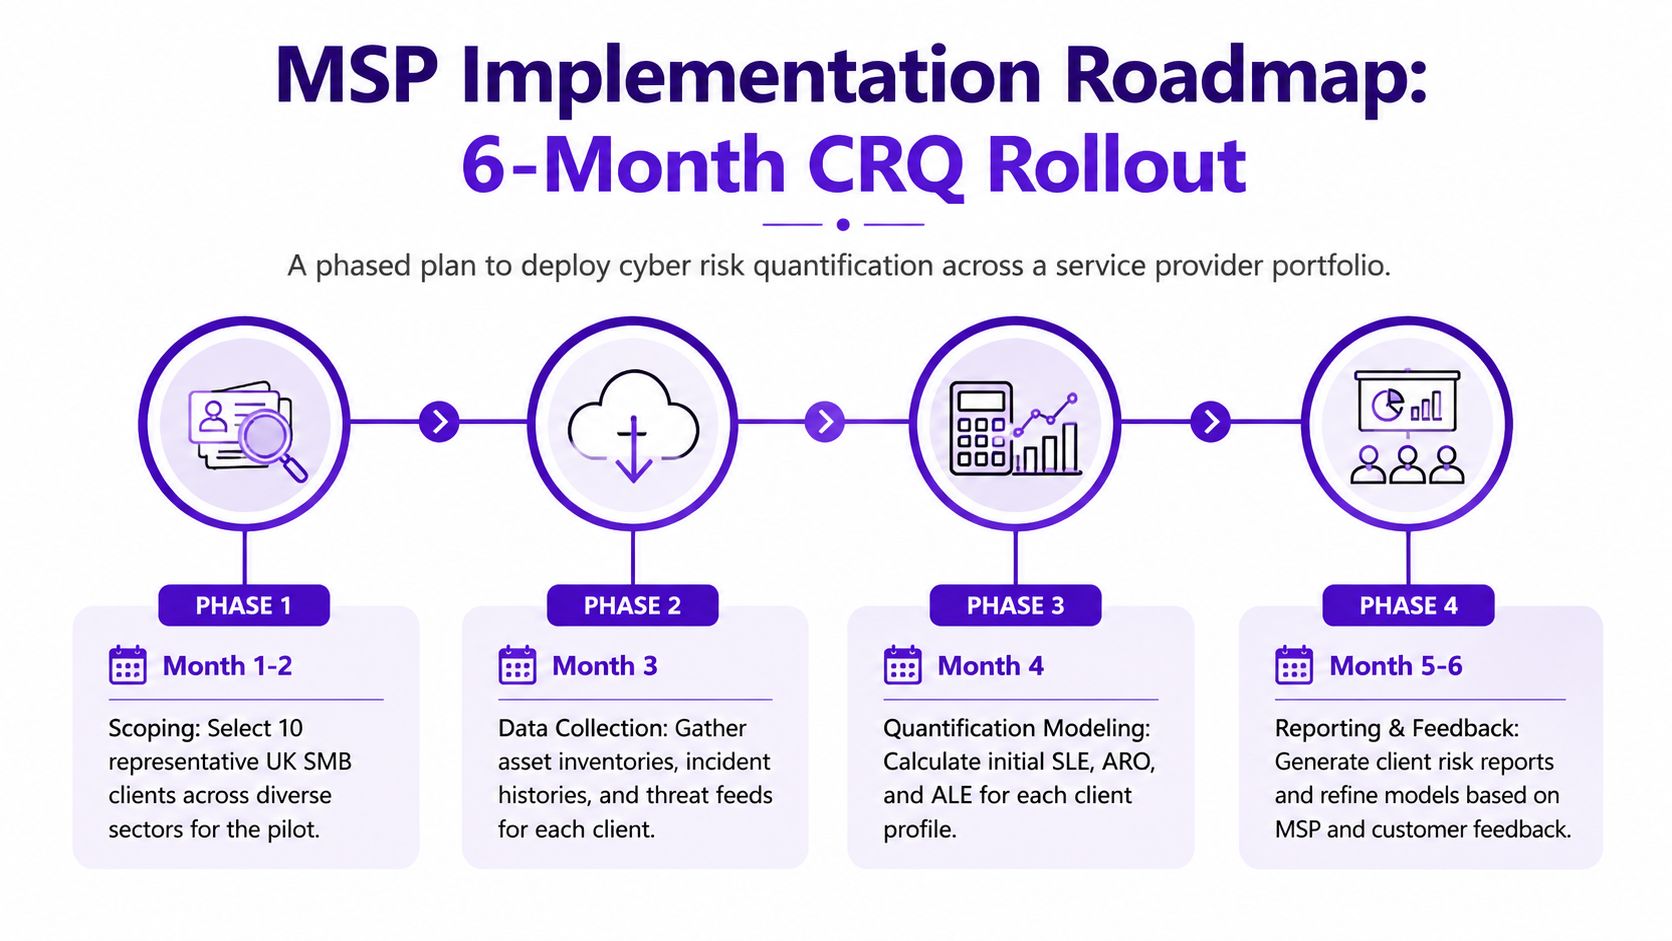
Scoping comes first. Select 10 representative UK SMB customers across different sectors and record their critical services, important data, key revenue dependencies, current controls, and known incident history. A spreadsheet is enough at this stage. The objective is to find variation in customer exposure, not to create a perfect asset database.
Next, collect evidence. Enable white-label dark web monitoring for each customer domain, establish a credential exposure baseline, and complete a short control questionnaire with the client. Capture the business context behind each alert. A leaked address used for a low-value mailbox isn't equivalent to an exposed finance or administrator account.
Phase three and phase four
Modelling converts the evidence into a small portfolio view. Use FAIR-aligned concepts to define the main loss scenarios, estimate frequency and magnitude ranges, and calculate ALE for each customer. Keep the executive output short, but retain a working paper that shows the sources and assumptions.
Reporting creates the recurring service. A quarterly business review should compare the current estimate with the previous review and explain movement through specific evidence, such as a newly exposed credential, a completed reset, an improved approval process, or an incident. The service provider can then connect each recommendation to an existing managed service or a clearly priced remediation task.
GoSafe's white-label capability fits into data collection and modelling by supplying branded exposure alerts that the reseller can present under its own company name. It doesn't remove the need for judgement. It reduces the operational burden of gathering and presenting an external signal.
The six-month roadmap should be treated as a rollout window, not a promise that every customer will reach the same maturity. Some accounts will need better asset information first. Others will be ready for a quantified renewal discussion immediately.
Common Challenges and How to Mitigate Them
CRQ isn't too complex for SMBs. It becomes impractical when a provider tries to model every system, every threat, and every possible loss before the customer understands the basic language.
The blockers that matter most
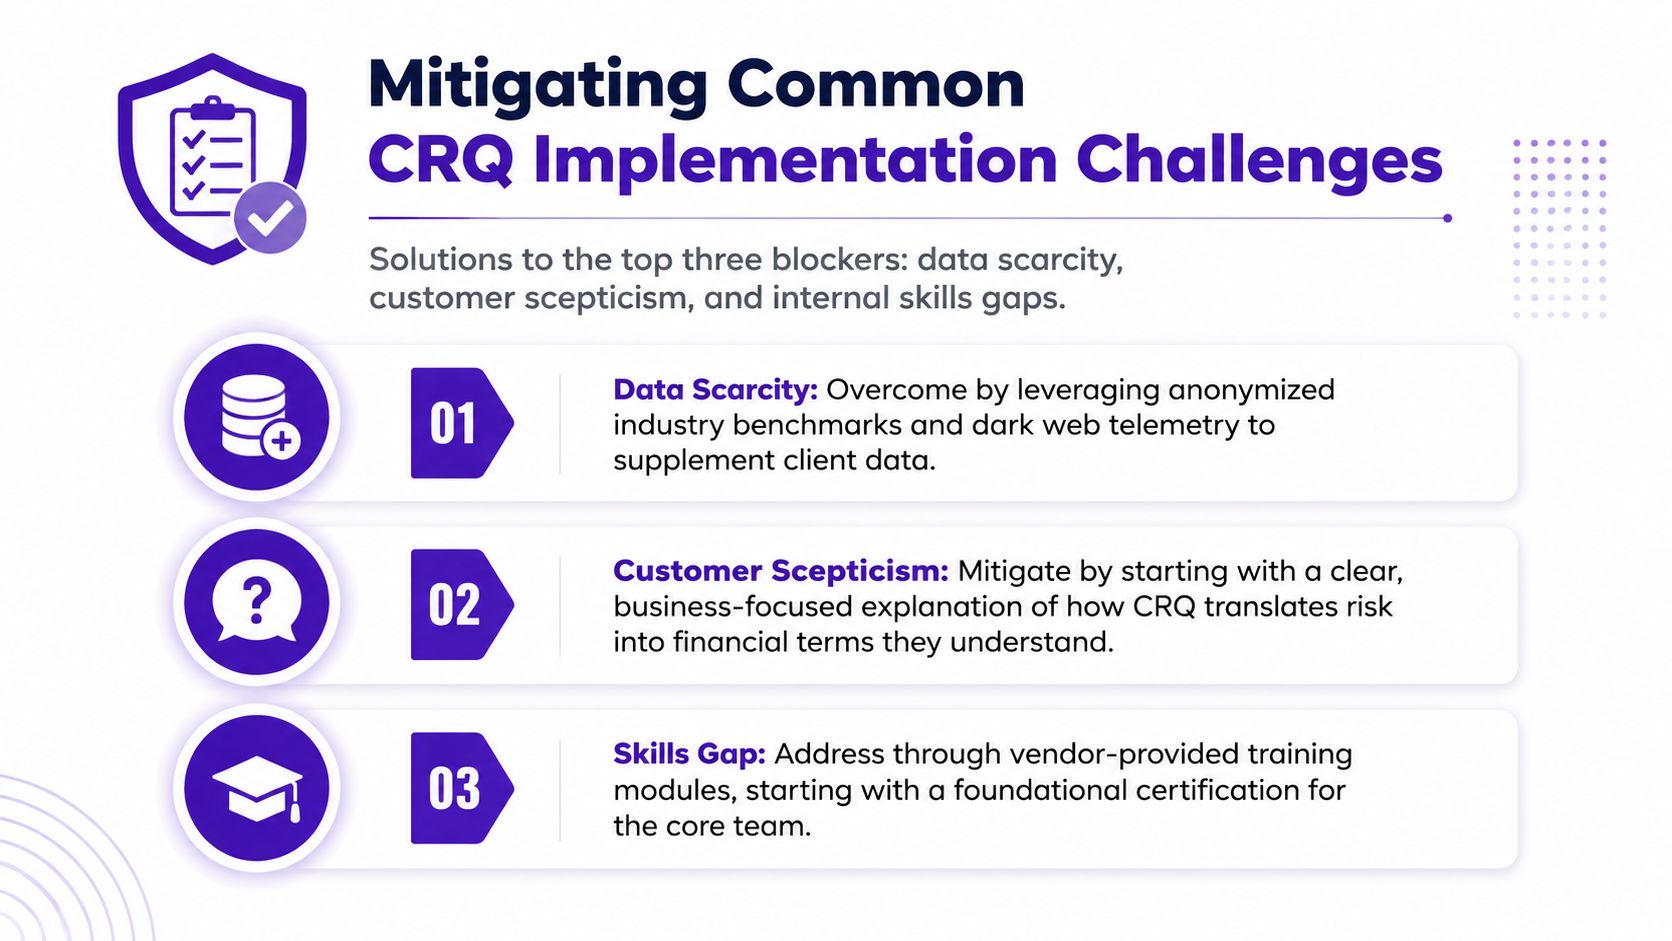
Data scarcity is normal. Start with external evidence, customer interviews, and a small number of material scenarios. Dark web exposure can provide a defensible likelihood input before the client supplies detailed control data, although it should supplement rather than replace internal evidence.
Customer scepticism usually reflects poor explanation, not resistance to measurement. Anchor the figure to a recognisable business event, such as a fraudulent payment or prolonged operational disruption, and show the assumptions openly. Don't present a national average as the customer's forecast.
Internal skills gaps are manageable when the provider standardises its method. Use a FAIR-lite template, define approved scenario categories, and train the account team to explain the model without pretending to be an actuary.
Keep the first model narrow: quantify the five loss scenarios most relevant to the customer, then expand after the reporting rhythm works.
Scope creep deserves separate attention. A broad assessment can consume time without producing a sellable service. A focused model produces a clearer report, a more manageable remediation list, and a better basis for deciding whether the customer will pay for ongoing monitoring.
Action Steps for MSPs and Resellers This Quarter
Start with three pilot customers from distinct verticals, such as UK legal, healthcare, and manufacturing. Baseline each customer's exposure with a simplified FAIR model, focusing on a few scenarios that connect directly to money, operations, or sensitive data.
Deploy continuous monitoring across the pilot domains and record how exposed credentials affect the likelihood assumptions over time. The aim isn't to create alarming weekly updates. It's to demonstrate that the customer's risk estimate responds to evidence and remediation.
Build a one-page report with four fields:
- Scenario: What loss could occur?
- Estimate: What are the frequency and impact ranges?
- Evidence: What changed since the previous review?
- Action: Which remediation or managed service addresses it?
Package the review as a recurring service alongside monitoring alerts. Position it as board-ready evidence and practical decision support, not as a compliance chore. Track which explanations, recommendations, and service bundles convert during the pilot before rolling the offer across the wider portfolio.
For providers building dark web monitoring for MSPs into their service catalogue, a white-label model keeps deployment simple. Partners can sell under their own name, add the service to IT support, cloud, hosting, connectivity, telecoms, web, or SaaS packages, and maintain ownership of the customer relationship without building specialist tooling internally.
GoSafe Dark Web monitoring continuously scans for compromised email addresses, exposed passwords, and breached domains, then provides clear alerts that can support live cyber risk quantification. Visit GoSafe Dark Web monitoring to see how the service can sit under your brand, support recurring revenue security services, and give customers practical evidence they can act on.